Foundation #3: Stock State Indicators
The TradeStops Stock State Indicators (SSI)* present a full life-cycle, indicating the health of your stock. The SSI is designed to tell you, at a glance, exactly where the stock stands—if it’s performing well, in a period of correction, or stopped out—and how long it’s been that way.
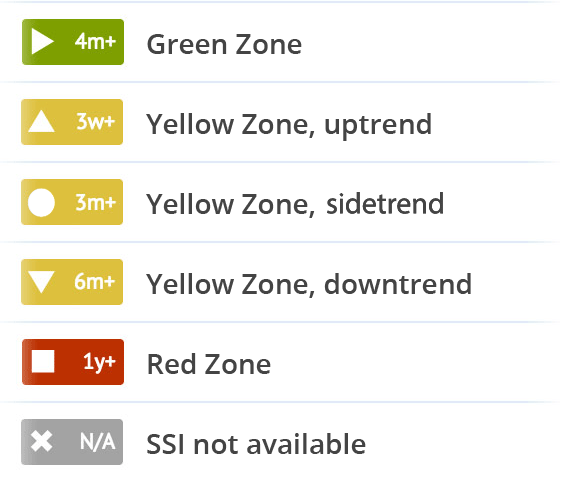
Using a green / yellow / red light system, the SSI Indicators tell us:
- When a stock is strong (green),
- When a stock has pulled back but is not yet stopped out (yellow); and
- When a stock has corrected more than expected and is currently stopped out (red).
Stock State Indicators are based on the VQ and performance of each stock and are not affected by whether or not you own the stock.
*Please note that the Stock State Indicator is only available to Plus and Premium subscribers.
You can upgrade any time! A stock requires 521 public trading days in order to have an SSI.